Home » Investigative Due Diligence » Link Analysis Charting
Link analysis charting is not an add-on service but an essential part of Veriton’s investigative process.
The most obvious benefit of link analysis charting is that it simplifies complex cases involving hundreds, if not thousands, of entities.
In a corporate environment, analyzing every link is rarely feasible due to time and budget constraints. Link charts effectively save resources and rapidly enhance the understanding of a case and its primary entities.
Furthermore, the charts are useful tools for briefing staff new to the case or providing a succinct summaries to clients both during and at the end of a project.
Importantly, the charts are investigative working tools and not simply report illustrations.
Centrally to charting, each relevant entity—physical or digital—is recorded following shape and colour conventions. These need to be used consistently throughout.
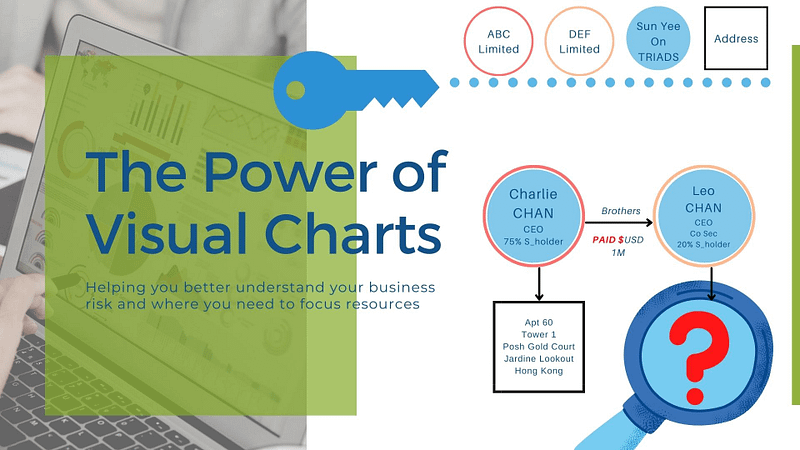
CHART CONVENTIONS: In this example, all individuals who have worked for ABC Limited are shown in a red circle. For Sun Yee On triad members, the circle background is blue. Thus, we can see that Charlie Chan is both the CEO of ABC Limited and a Sun Yee On triad member.
COMMODITY FLOW: Sometimes, charts are used to depict the flow of a commodity between two entities. Here, we know that Charlie CHAN paid his brother Leo CHAN USD 1M. If we understood the reason for the transaction—e.g. a falsified invoice—this could also be noted on the chart.
ADDRESSES: Typically, relevant addresses are placed in squares or rectangles. If an entity owns a car, a car icon could be drawn on the chart or the registration number simply inserted under the owner’s name.
DATE: Chart versions should be dated as they represent the situation as understood at a given point in time.
Initially, we reserved link charts for large cases. However, we find that they can speed up even the smallest of investigations. Currently, we employ them on almost a daily basis.
They are especially useful in understanding fraud, on-line scams and the structure of a large company.
Without exception, all clients benefit from having link charts. They are helpful to everyone from the insurance industry to large construction companies involved in mergers and acquisitions.
Incredibly, the largest chart we produced was nearly 3 metres in length! It was for a wildlife NGO. There were upwards of 60 companies and associations. One of the associations had over one hundred members, and between all the companies, there were well over 300 directors and shareholders.
The number of companies was not unusual for a large case. However, in this particular project, there were multiple interconnections going back many years.
In addition, the case encompassed a wide geography spanning China, Hong Kong, Macau as well as other SE Asian and African countries.
A few years ago, we were hired to analyse and chart telephone calls for a corporate investigation in Malaysia.
A large food manufacturer discovered that another food company was illegally manufacturing and distributing its products.
Using an in-house database, we analysed more than 36,000 calls made between individuals and company numbers as part of the effort to track down the suspects. Finally, the results were summarized in link charts which highlighted individuals within the company who were colluding with the rogue manufacturer.
NB: The call records were provided by the client company. Most of the data was in digital format, but not all.
The most common link analysis software is well beyond the budget of medium-sized lawyer practices and investigative agencies.
We are currently developing a 6-week link charting online training course with a low cost software provider. The training is for all types of business—private investigators, lawyers, in-house research departments—who need to more quickly understand complex business relationships.

Veriton Investigations was co-founded in 2014 by an ex-Hong Kong police officer and a research/ communications professional. They recognized a need in the private investigator industry to combine high quality reporting and analysis with discreet, feet-on-the-ground investigations and surveillance.
Veriton Investigations is a brand of the Veriton Asia Group. We offer a comprehensive portfolio of research and investigations services from full reputational due diligence and surveillance to China company checks, executive screening and process serves.
Get the Veriton newsletter for updates and special offers available ONLY to our subscribers.
Get the Veriton newsletter for updates and special offers available ONLY to our subscribers.
Established in 2014 as part of the Veriton Asia Group, Veriton Investigations provides international clients with professional investigative and research services in Hong Kong, Macau, China and other parts of SE Asia.
Confidentiality and discretion are guaranteed.
Established in 2014 as part of the Veriton Asia Group, Veriton Investigations provides international clients with professional investigative and research services in Hong Kong, Macau, China and other parts of SE Asia.
Confidentiality and discretion are guaranteed.
| Cookie | Duration | Description |
|---|---|---|
| cookielawinfo-checkbox-analytics | 11 months | This cookie is set by GDPR Cookie Consent plugin. The cookie is used to store the user consent for the cookies in the category "Analytics". |
| cookielawinfo-checkbox-functional | 11 months | The cookie is set by GDPR cookie consent to record the user consent for the cookies in the category "Functional". |
| cookielawinfo-checkbox-necessary | 11 months | This cookie is set by GDPR Cookie Consent plugin. The cookies is used to store the user consent for the cookies in the category "Necessary". |
| cookielawinfo-checkbox-others | 11 months | This cookie is set by GDPR Cookie Consent plugin. The cookie is used to store the user consent for the cookies in the category "Other. |
| cookielawinfo-checkbox-performance | 11 months | This cookie is set by GDPR Cookie Consent plugin. The cookie is used to store the user consent for the cookies in the category "Performance". |
| viewed_cookie_policy | 11 months | The cookie is set by the GDPR Cookie Consent plugin and is used to store whether or not user has consented to the use of cookies. It does not store any personal data. |
Avoid losing time and money with your next research or investigations project!
Why not sign up for our occasional newsletter to get your free eBook? Contains useful advice with guidelines to help you get ready for an investigation.